

Benchmarking ESPi
benchmark-espi runs the ESPi ground-truth questions against the local ESP stack, records every answer with its
latency, cost, tokens and tool calls, and lets you compare runs side by side. This guide covers the initial setup, then walks
through the UI page by page. For the full CLI and the architecture, see benchmark-espi/README.md in the
data-science repo.
Initial setup
These steps start the ESP stack and set benchmark-espi up from scratch, with no database or earlier runs. Allow about 30 minutes, plus the time the stack takes to start.
0. Prerequisites
- uv, Node + yarn, and a JDK for platform-api.
- The local ESP dev stack (infra-devenv-pro) running, with CAS on
127.0.0.1:8085. For the page-context questions and the data rubrics, the loaded data must be the heavy volume snapshot (esp-database-8,esp-postgresandesp-osnode-1allheavy), because the scenario file's entity ids and the data rubrics' facts (rubrics/facts/heavy/) come from it. - A benchmark user's login for the local stack (default
user@esprofiler.com), without MFA. - The TypeSafe key that platform-api uses as
ESP_JEV_API_KEY. The app uses the same key to grade answers. - Langfuse keys for the
esp-developmentproject, for the cost, token and tool-call metrics. They're optional, but without them nothing is enriched.
The expected layout, which the app uses to detect the builds:
~/development/backend/platform-api
~/development/frontend/platform-docs
~/development/infra-devenv-pro
~/development/data-science
If your checkouts are elsewhere, change the cd paths below and set these in .env (step 3), otherwise the build
pre-fill, the scenario checks and the dataset detection won't find them:
PLATFORM_API_REPO: your platform-api checkoutPLATFORM_DOCS_REPO: your platform-docs checkoutINFRA_DEVENV_CONFIG: infra-devenv-pro'sconfig.json
For Docker, the equivalents are PLATFORM_API_HOST_REPO, PLATFORM_DOCS_HOST_REPO and INFRA_DEVENV_HOST_DIR.
They default to paths relative to compose.yaml that assume the same layout.
1. Start platform-docs (the docs MCP server)
Start it before platform-api, because platform-api connects to it when it starts.
cd ~/development/frontend/platform-docs
git checkout main
git pull
yarn install
yarn mcp:start
It should log:
[MCP INFO] Platform Docs MCP Server listening on http://127.0.0.1:9998/mcp (SSE & Streamable HTTP)
A "Documentation site not found ... Run yarn docs:build" error only means the docs website isn't served. The MCP tools still work, so it doesn't matter here. Leave this terminal open.
2. Start platform-api
For Jev routing to the docs agent, platform-api must be on a build that includes it (at the time of writing, the
715-add-jev-and-langgraph4j-to-espi branch):
cd ~/development/backend/platform-api
git checkout 715-add-jev-and-langgraph4j-to-espi
git pull
$env:ESP_JEV_API_KEY = "<TypeSafe key>"   # if it isn't already set in your environment
$env:SPRING_PROFILES_ACTIVE="dev"; $env:COMMIT_INFO = git rev-parse HEAD; .\mvnw.cmd spring-boot:run
SPRING_PROFILES_ACTIVE=devturns the Jev router on and points platform-api at the local docs server (http://localhost:9998/mcp).COMMIT_INFOmakes/api/v1/inforeport the commit. The benchmark then records it on each run as the platform-api build (source: reported). Without it, the build is only a guess from the checkout.
Wait until the platform is up on 127.0.0.1:8088.
Check that platform-api has connected to platform-docs. The platform-docs terminal should show new requests, such as:
[MCP INFO] Handling POST request with StreamableHTTPServerTransport
If nothing appears, platform-api hasn't reached the docs server, and docs questions will get no documentation. Check that platform-docs is still running on port 9998, then restart platform-api.
3. Set up the app
cd ~/development/data-science/benchmark-espi
copy .env.example .env
In .env, fill in:
ESP_PASSWORD(andESP_USERNAMEif it isn'tuser@esprofiler.com)JEV_API_KEY: the TypeSafe keyLANGFUSE_PUBLIC_KEYandLANGFUSE_SECRET_KEY
If your checkouts aren't under ~/development, also set the repo paths listed in step 0. Leave the rest as it is.
Then:
uv sync
uv run benchmark-espi init-db       # creates data/benchmark.db
uv run benchmark-espi check-auth    # logs in to CAS and prints the platform info
check-auth should print the platform version with a commitTag that matches platform-api's git rev-parse HEAD.
Load the question set, the rubrics and the scenarios:
uv run benchmark-espi import-questions questions/espi-groundtruth.csv --name "ESPi Groundtruth"
uv run benchmark-espi import-rubrics rubrics/espi-groundtruth-docs-help.yaml
uv run benchmark-espi import-rubrics rubrics/espi-groundtruth-capability.yaml
uv run benchmark-espi import-rubrics rubrics/espi-groundtruth-data.yaml
uv run benchmark-espi import-rubrics rubrics/espi-groundtruth-market.yaml
uv run benchmark-espi import-scenarios scenarios/espi-groundtruth.yaml
uv run benchmark-espi check-scenarios -q "ESPi Groundtruth"
uv run benchmark-espi collect-facts --check
Expected:
- 79 questions imported, and a rubric on every one of them once the four rubric files are loaded.
import-scenariosaccepts every context. It checks the route names against the platform-api checkout'ssitemap.json.check-scenariosfinds every context entity. A missing entity means a different data snapshot is loaded. Those questions will fail with "Context check failed" rather than be asked.collect-facts --check(read-only GETs) finds the loaded data matching the data rubrics' snapshot. Drift means the data rubrics' figures may not hold for this data, so those answers can be graded wrongly. Ownership and annualised values follow contract dates, so a little drift on the heavy snapshot is possible (seebenchmark-espi/rubrics/README.md).
4. Start the app
Two processes need to be running, in two more terminals, both in benchmark-espi:
| Process | Command | Why |
|---|---|---|
| Worker | uv run benchmark-espi worker | Executes queued runs, fetches Langfuse metrics and grades answers. The UI only queues runs. |
| UI | uv run streamlit run app/streamlit_app.py | Opens on http://localhost:8501 |
If runs sit in the queue for more than 30 seconds with nothing running, every page shows a "Is the worker up?"
warning. Grading needs the Jev key (JEV_API_KEY), or Ollama running on the host if you use the local
judge.
To check everything works without LLM spend, queue a Dry run of a few questions from New run. It should complete within seconds, with a fake answer per question.
Docker (optional)
Instead of step 4, you can run the worker and UI in containers. Stop any local worker and Streamlit first: they
mustn't share ./data with the containers.
docker compose up -d --build
The UI is on http://localhost:8501 again, and the containers reach the host's ESP stack through
host.docker.internal.
Resetting
To start again from no data, stop the worker and the app and delete data/benchmark.db* (and data/backups/ if you
like). Then repeat step 3 from init-db. See benchmark-espi/data/README.md.
A typical session
- Questions. Import the ground-truth CSV once, then browse it by tag.
- New run. Pick questions, repeats and labels, check the call count and cost estimate, and queue the run.
- Runs. Watch progress live, then look at per-question stats, charts and errors. Export to CSV or JSON.
- Compare. Put the new run against a baseline to find regressions, then read the answers side by side.
- Conversation. Drill into a single answer: its metrics, every tool call with its input, and the Langfuse traces.
Pages
| Page | Use it to |
|---|---|
| Home | See headline counts and recent runs |
| Questions | Import and browse question sets |
| New run | Configure and queue a run |
| Runs | Follow a run and inspect its results |
| Compare | Compare a baseline with one or more candidate runs |
| Conversation | Inspect one answer in detail |
Pages link to each other through query parameters, so any view can be bookmarked or shared: runs?run_id=17,
compare?baseline=7, conversation?result_id=257, questions?question_id=38.
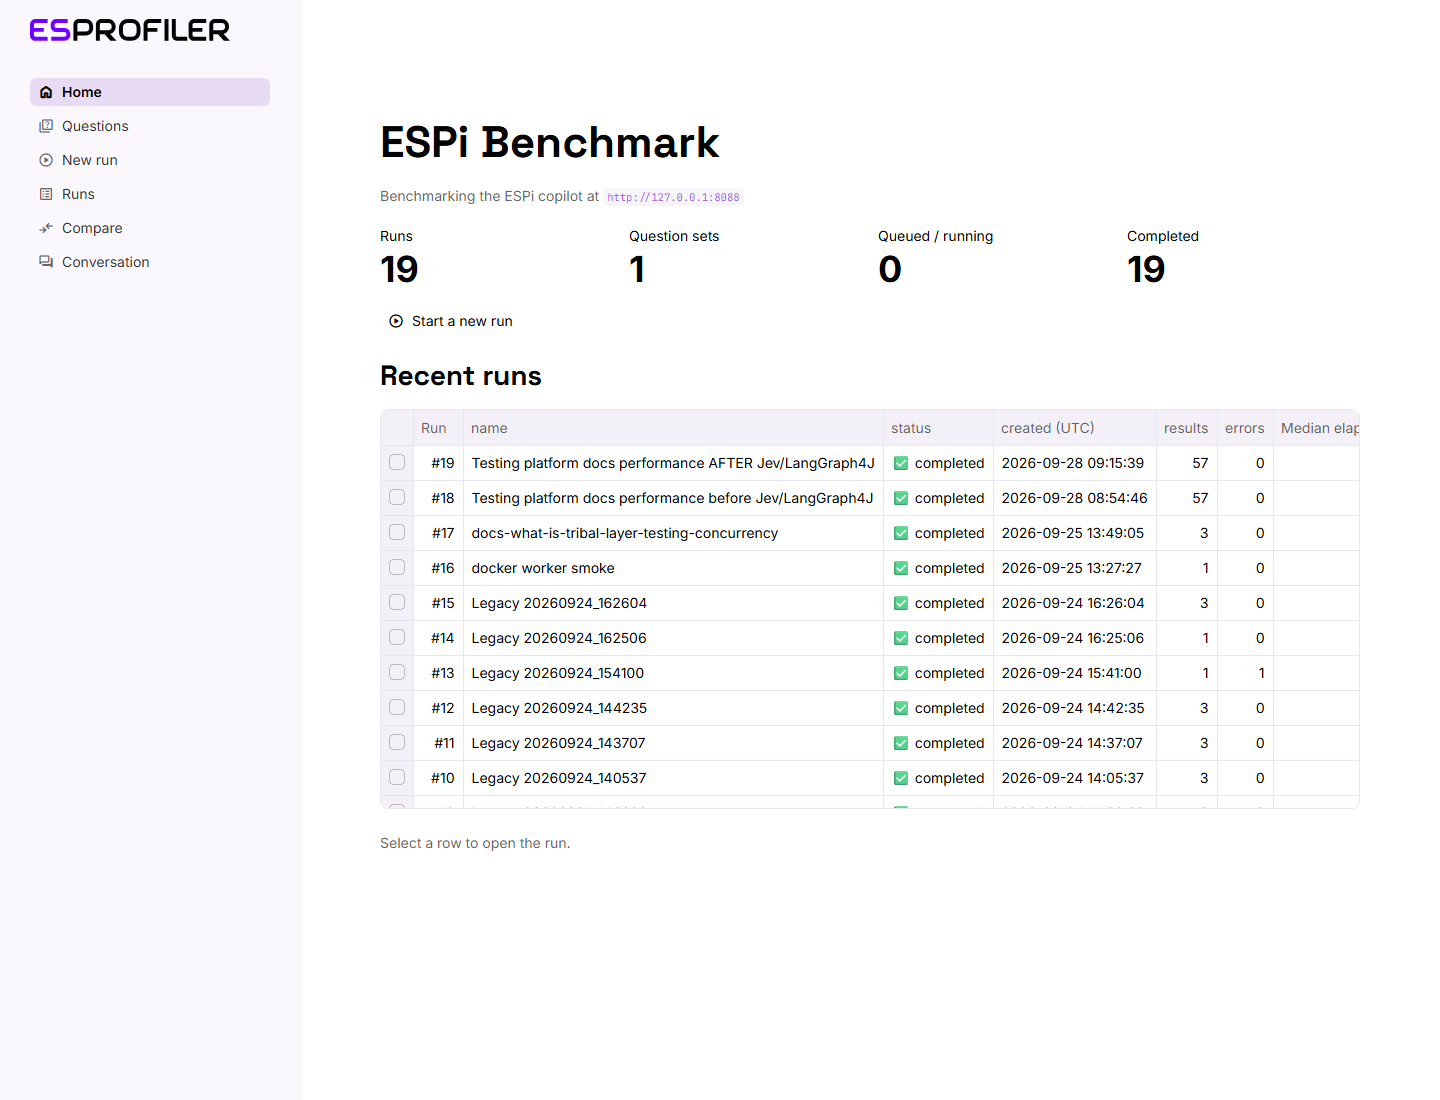
Home
The landing page shows how many runs and question sets exist, how many runs are queued or running, and how many have completed. The Recent runs table lists the latest 25 runs with their status, result and error counts, median elapsed time, total cost, median tokens, median tool calls, labels and whether they were dry runs. Select a row to open that run on the Runs page.
Metrics at a glance
| Metric | Where it comes from |
|---|---|
| Elapsed (s) | Wall-clock time from sending the question to the end of the answer stream |
| Time to first token (s) | Time until the first text-delta event in the stream |
| Tool calls | Langfuse observations named execute_tool*, across every trace in the conversation |
| Cost, input/output/total tokens | Langfuse session totals |
| Grade score, pass rate | The judge's check of the answer against the question's rubric (see Grading) |
Elapsed and time to first token are recorded as soon as an answer arrives. The Langfuse metrics arrive about a minute later, because the worker waits for Langfuse ingestion before fetching them. Until then those columns are empty. All times are shown in UTC.
Questions
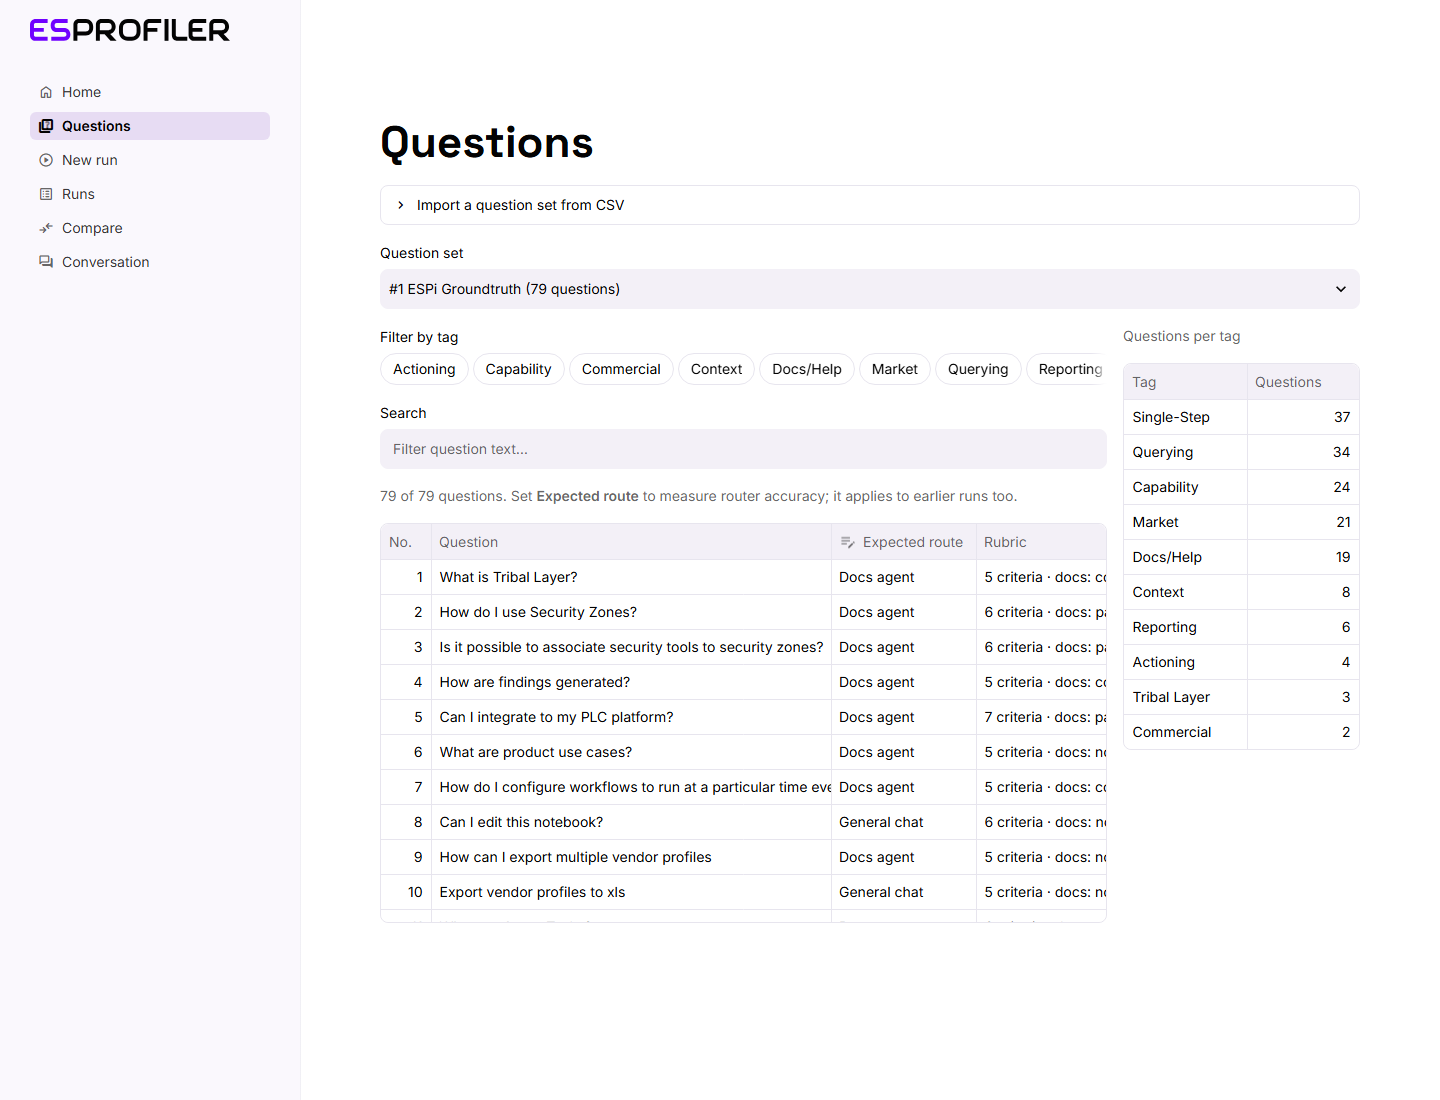
A question set is a numbered list of questions, each with any number of tags. Runs always draw their questions from one set.
Importing a set
Expand Import a question set from CSV, upload the file, give the set a name (it defaults to the file name) and click Import. The CSV needs these columns:
| Column | Required | Notes |
|---|---|---|
Question No. | yes | The question's number within the set |
Question | yes | The question text |
Tag 1 … Tag n | no | One tag per column; empty cells are ignored |
Expected Answer | no | Stored with the question for reference |
Expected Route | no | Where the router should send it: docs / platform-docs, or chat / fallback. Blank means unset. |
The same import works from the command line:
uv run benchmark-espi import-questions questions/espi-groundtruth.csv --name "ESPi Groundtruth"
Browsing a set
Pick a set from Question set. Then:
- Filter by tag. Click one or more tag pills to show questions that have any of the selected tags.
- Search. Type to filter the question text (case-insensitive).
- Questions per tag. The table on the right shows how many questions carry each tag, which helps when you choose tags for a run.
The caption above the table shows how many questions match, for example "12 of 79 questions".
The Rubric column shows which questions are graded, for example 6 criteria · docs: partial or
5 criteria · data: heavy: the number of criteria, and how much of the answer the platform docs contain (covered,
partial or none), the dataset the data criteria describe, or the date the market facts were researched. Rubrics are
edited in rubrics/*.yaml and loaded with uv run benchmark-espi import-rubrics, not on this page. See
Grading.
Reading a rubric
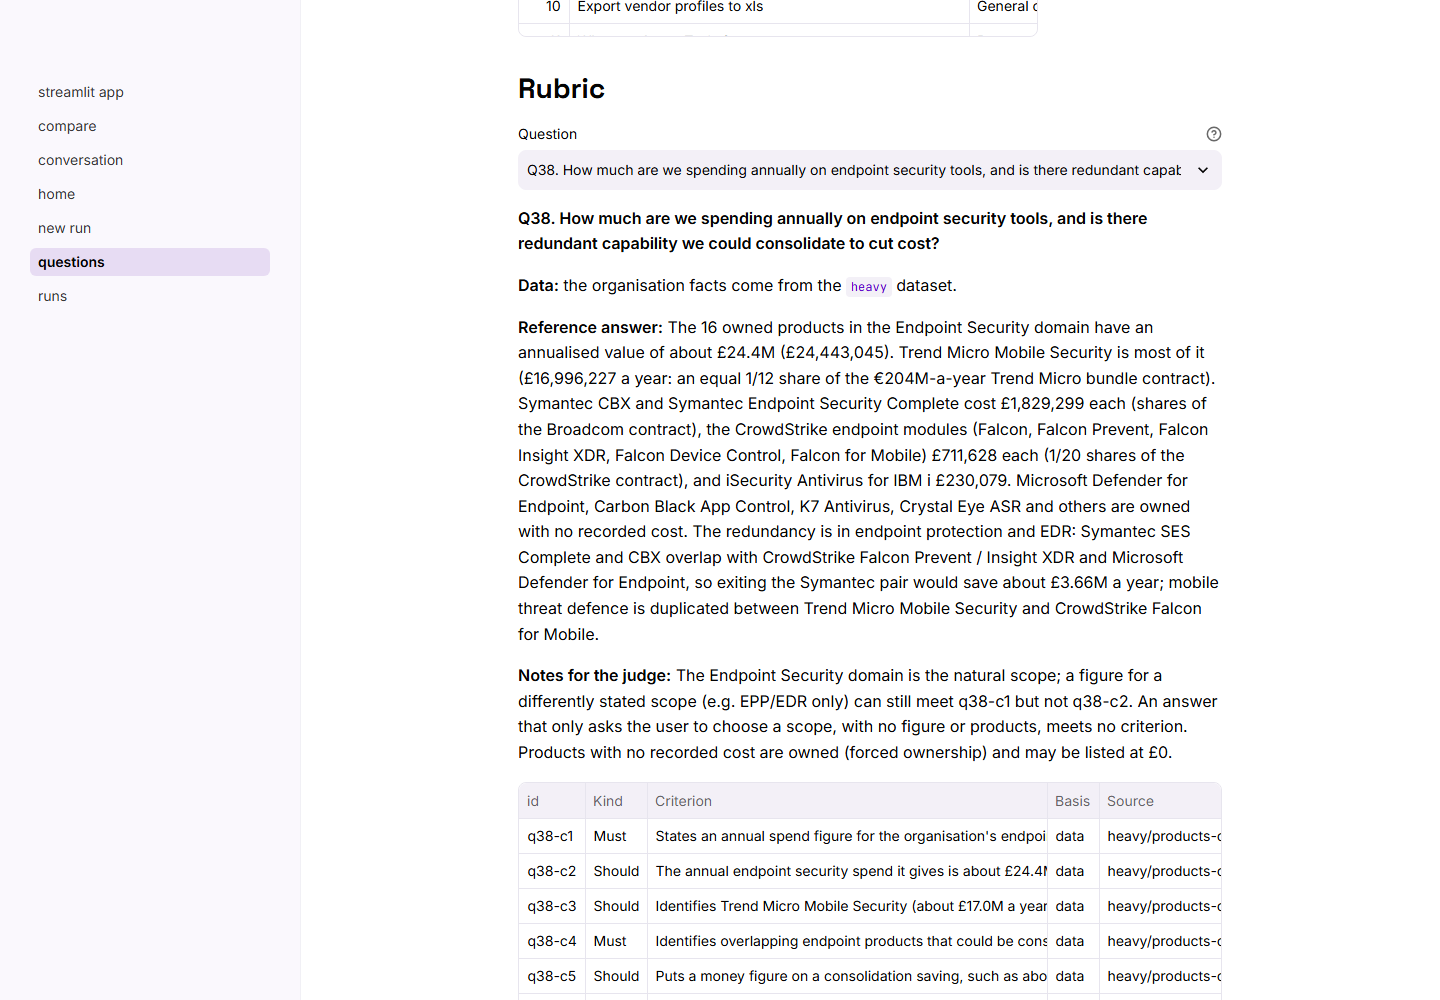
The Rubric section under the table shows one question's full rubric, without needing a run. Question lists the questions in the table (after the tag and search filters) that have a rubric. For the one you pick it shows:
- the docs coverage and why, the dataset, or the as-of date of the market facts;
- the reference answer, what to do if the answer says the docs don't cover it, and the notes for the judge;
- a table of the criteria: Kind (must, should, must not), the Criterion, its Basis (docs, product, data
or web) and its Source, where its ground truth comes from (e.g.
heavy/products-owned.json).
The pick is kept in the URL, so questions?question_id=38 links straight to a rubric. The Conversation page links
here from Rubric and reference answer.
The Scenario column marks questions that are a turn of a multi-turn conversation, or are asked on a UI page,
e.g. turn 2 of similar-products or on notebook.view (Q3 board summary). Scenarios are edited in
scenarios/*.yaml and loaded with uv run benchmark-espi import-scenarios. See benchmark-espi/scenarios/README.md
in the data-science repo.
Expected routes
Set Expected route in the table to Docs agent or General chat (or clear it). Changes save straight away. The expectation belongs to the question, so it also applies to runs made before you set it. It drives the routing metrics: expected-agent hits and router accuracy.
To set many at once, use the command line:
uv run benchmark-espi expect-route -q "ESPi Groundtruth" --tag Docs/Help --route docs
uv run benchmark-espi expect-route -q "ESPi Groundtruth" --questions 8,10 --route chat
New run
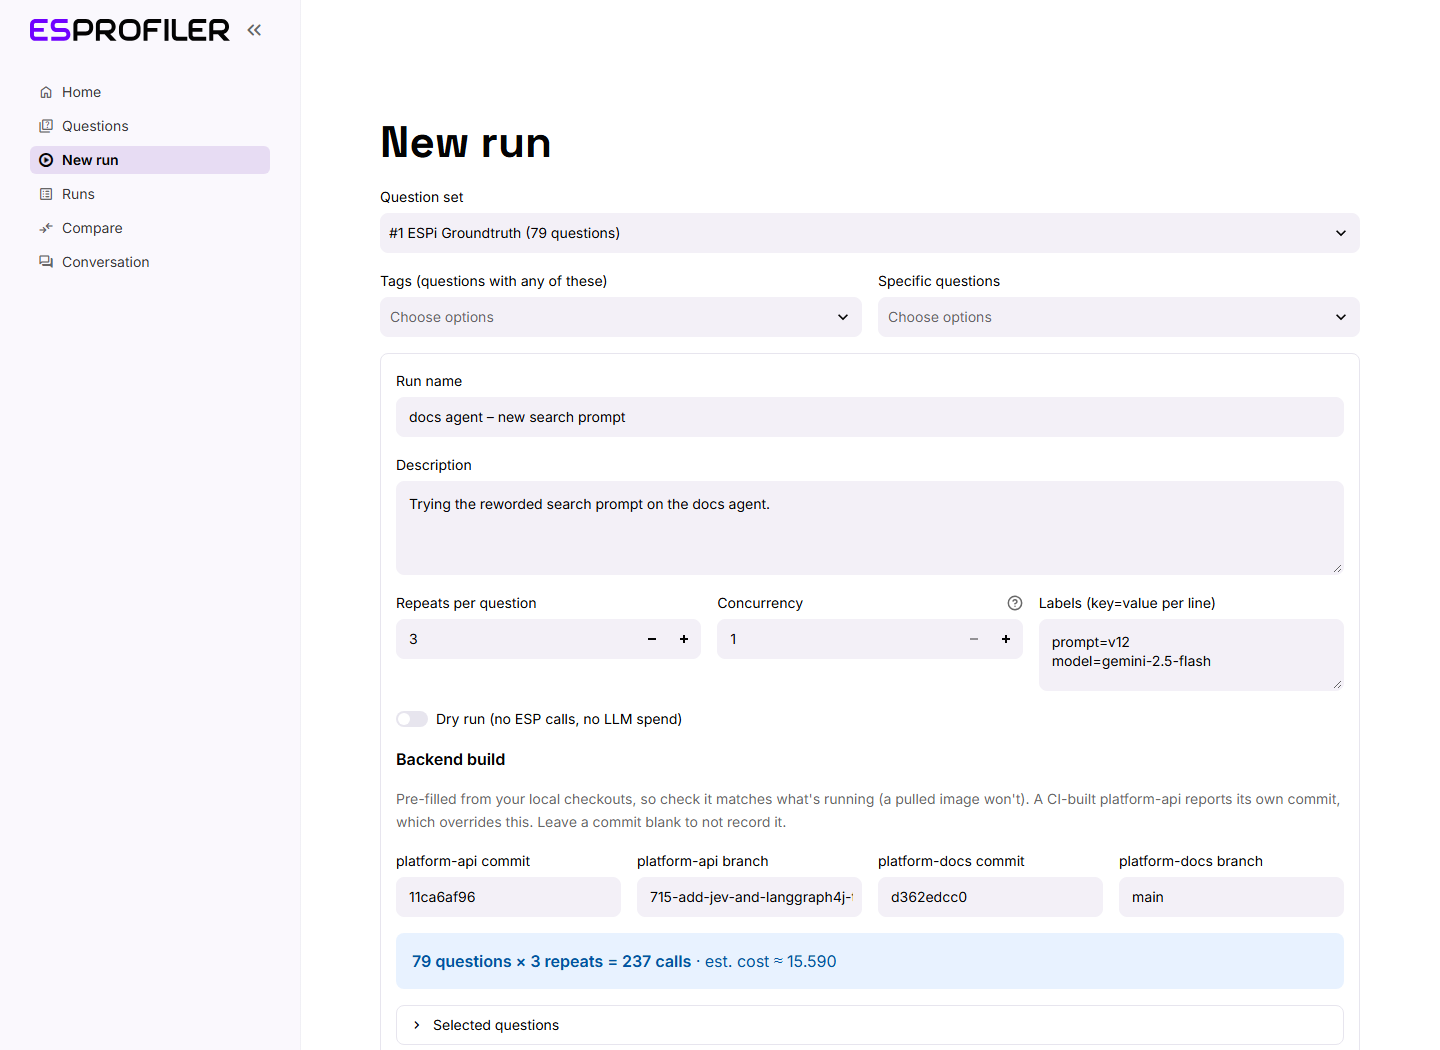
This page configures a run and puts it in the queue. It doesn't execute anything itself: the worker picks the run up and you follow it on the Runs page.
Choosing questions
| Field | Effect |
|---|---|
| Question set | The set to draw from |
| Tags | Include questions that have any of these tags |
| Specific questions | Include these question numbers |
Leave both Tags and Specific questions empty to run the whole set. Expand Selected questions to check exactly which questions will run; its Scenario column marks conversation turns and page contexts. The selection is snapshotted when you queue the run, so later edits to the set don't change it.
Conversations and page contexts
Some questions are turns of a multi-turn conversation, or are asked on a UI page (see benchmark-espi/scenarios/README.md
in the data-science repo). When the selection includes any, a section appears above the call count:
- Adds Q…: selecting a follow-up brings its conversation's earlier turns with it. They're asked first, in the same ESP conversation. Each repeat is a separate conversation.
- Page contexts: how many selected questions are asked on a page, and which data snapshot is loaded (from
infra-devenv-pro's
config.json). A warning appears when that differs from the snapshot the scenario file was written against. Check page contexts fetches each page's entity now, as the worker will before asking. It shows any that are missing, with ids to use instead.
Run settings
| Field | Notes |
|---|---|
| Run name | Required. Describe what's being tested, e.g. docs agent – new search prompt. |
| Description | Optional notes on what changed. Shown at the top of the run. |
| Repeats per question | 1–20. Use 3 or more to see how much answers and latency vary. |
| Concurrency | 1–16 parallel requests (default from DEFAULT_CONCURRENCY). Higher values speed the run up but change the latency figures, so compare runs that used the same concurrency. |
| Labels | key=value, one per line, e.g. prompt=v12. Shown on the run and on the Home table; useful for recording the prompt version or model. |
| Dry run | Uses a fake client: no ESP calls and no LLM spend. Good for checking the pipeline. Dry runs aren't enriched from Langfuse. |
Backend build
Record which platform-api and platform-docs builds the run is against, so a before/after comparison says what changed. Each has a commit and a branch field.
- Pre-filled from your local checkouts (
PLATFORM_API_REPOandPLATFORM_DOCS_REPO, by default~/development/backend/platform-apiand~/development/frontend/platform-docs). That's only a guess: if the service is running from a pulled image, or was started before you switched branch, correct it. A note appears when a checkout has uncommitted changes. In Docker, compose mounts the checkouts read-only (override the host paths withPLATFORM_API_HOST_REPOandPLATFORM_DOCS_HOST_REPO); there the dirty check is off, so it isn't flagged. - Edit or clear it as needed. An edited entry is recorded as
manual; a blank commit records nothing. - A CI-built platform-api reports its own commit through
/api/v1/info, and that wins when the run starts. A local platform-api reportsnot-assignedunless it's started withCOMMIT_INFO=<sha>(e.g.COMMIT_INFO=$(git rev-parse HEAD)), which is worth doing: then the build is recorded without typing. - Dry runs don't record a build.
- The run also records the loaded data snapshot (the infra-devenv-pro volume tags,
INFRA_DEVENV_CONFIG).
Call count and cost estimate
The blue box updates as you change the settings:
79 questions × 3 repeats = 237 calls · est. cost ≈ 21.481
The estimate is the average cost of every successful result so far, multiplied by the number of calls. It's a rough guide: different agents and questions cost very different amounts. It's hidden for dry runs and until there's some history.
Queueing
Click Queue run. The app creates one pending result per question × repeat and takes you straight to the run on the Runs page.
From the command line, benchmark-espi run ... --queue does the same thing; without --queue it runs inline in
that terminal instead:
uv run benchmark-espi run -q 1 --name "docs agent – new search prompt" --tag Docs/Help --repeats 3 --label prompt=v12 --queue
The CLI also pre-fills the backend build from the local checkouts (turn that off with --no-detect-builds). Give a
component explicitly with --build COMPONENT=COMMIT[@BRANCH], e.g. --build platform-api=11ca6af96@feature/jev.
Runs
The Runs page shows one run at a time. Pick it from the Run selector, or arrive from the Home table or straight after queueing.
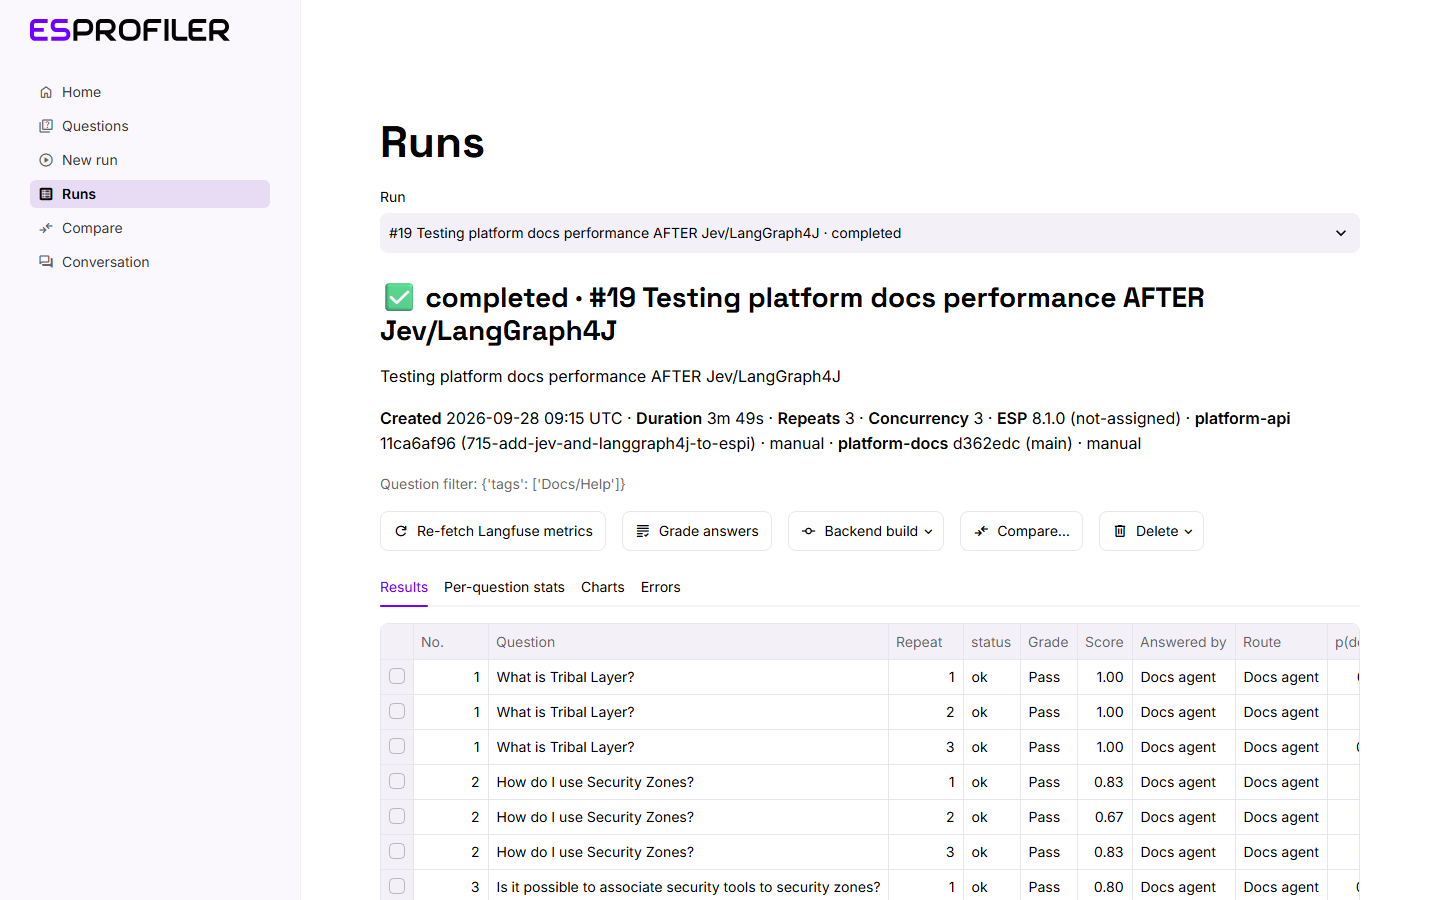
Header
Under the run's status and name you'll find:
- the description, if there is one
- when it was created, how long it took, the repeats and the concurrency
- the ESP backend version and commit tag, recorded by the worker's preflight call to
/api/v1/info - the platform-api and platform-docs builds, e.g.
11ca6af96 (feature/jev) · reported, ornot recorded. The source says how far to trust it:reported(platform-api's/infosaid so),checkout(the local checkout's HEAD when the run was queued) ormanual(typed or edited). A warning appears when platform-api reported a different commit from the one entered for the run. - the loaded data snapshot, e.g.
heavy (all volumes), with a warning when the run asked questions on pages written against a different snapshot (seebenchmark-espi/scenarios/README.mdin the data-science repo) - the labels, and the question filter (tags and question numbers) the run was created with
- any run-level error, for example a failed login
Actions
| Button | When | What it does |
|---|---|---|
| Cancel run | Queued or running | Stops the run. Results already in flight finish; the rest are marked cancelled. |
| Re-fetch Langfuse metrics | Finished, not a dry run | Re-queues every result for enrichment. Use it when metrics are missing because Langfuse was slow or unreachable. |
| Grade answers | Finished, not a dry run | Queues the run's answers for the judge again, e.g. after a rubric change or for a run made before grading. |
| Backend build | Not a dry run | Edits the recorded builds, e.g. to backfill an old run or correct a guess from the checkout |
| Compare… | Always | Opens Compare with this run as the baseline |
| Delete | Finished | Deletes the run and all its results, after a confirmation |
Results tab
One row per question × repeat, showing status, the grade (Grade, Score), the routing (Answered by, Route, p(docs),
Route reason), elapsed time, time to first token, cost, tokens, tool calls, the Langfuse enrichment status and
any error. While the run is active the table refreshes every 3 seconds and a progress
bar shows done / total results · errors. When the run finishes, the whole page refreshes.
Select a row to open that answer on the Conversation page.
Per-question stats tab
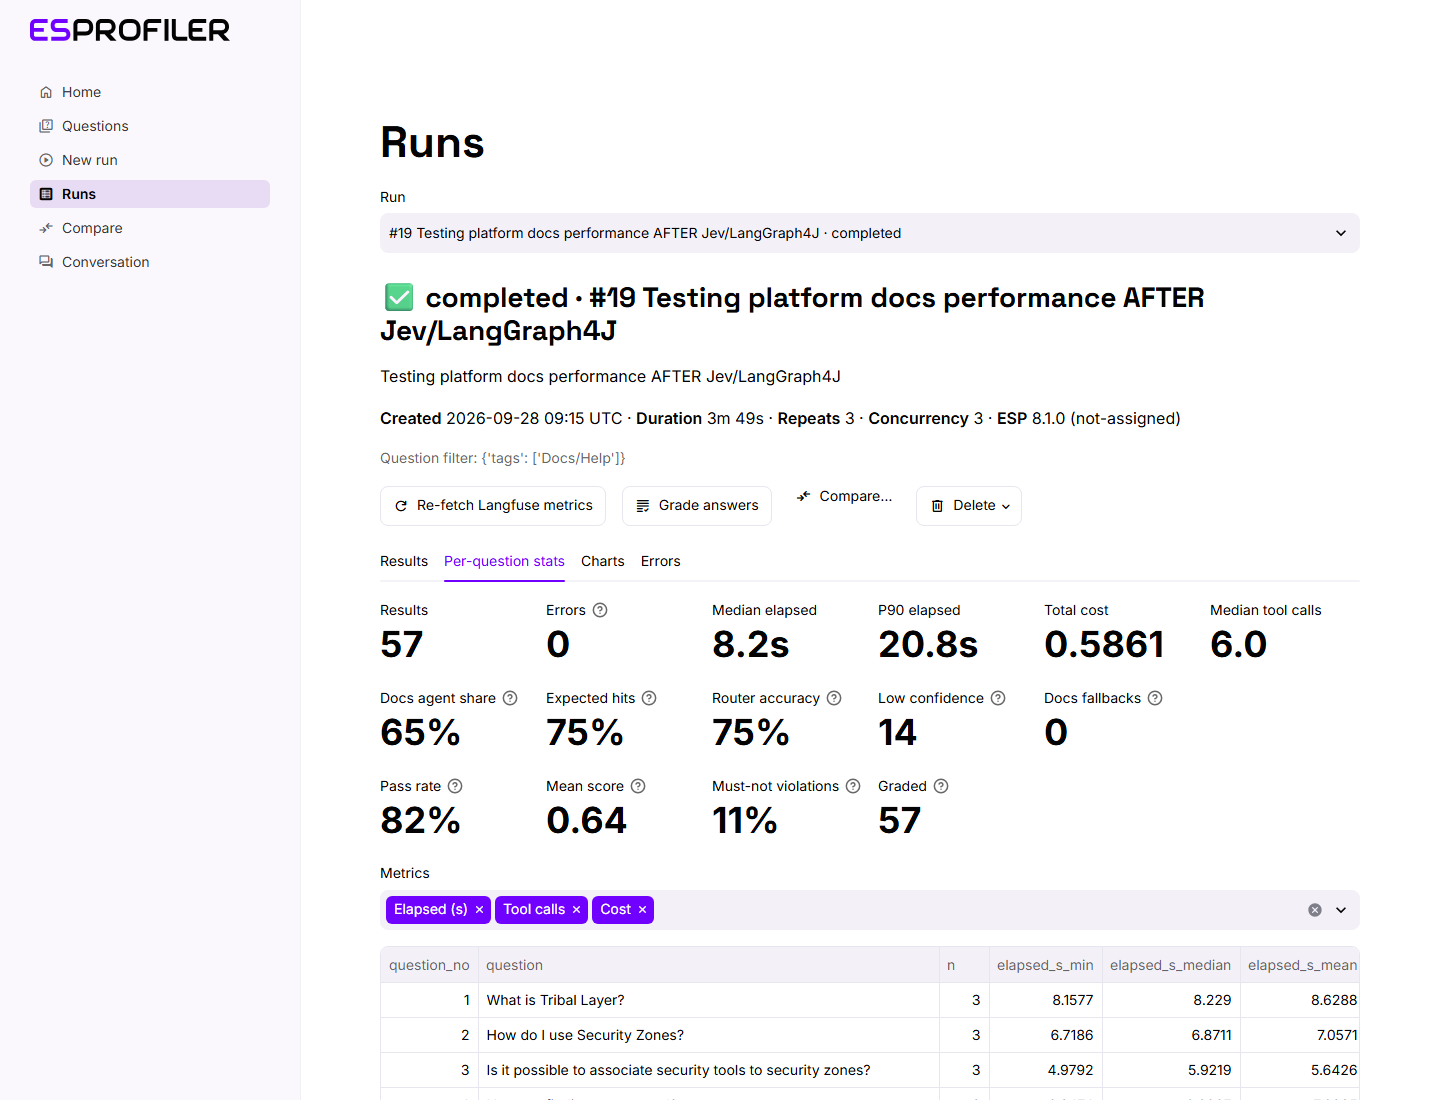
The headline figures cover the whole run: results, errors (hover for the error rate), median and P90 elapsed, total
cost and median tool calls. Below them, choose which Metrics to show. For every question the table then gives
the number of successful results (n) and the min, median, mean, max and standard deviation of each metric across
its repeats. Failed results are left out of these figures.
A second row shows the routing metrics: Docs agent share, Expected hits, Router accuracy, Low confidence (Jev chose docs, but the confidence gate sent it to general chat) and Docs fallbacks.
Charts tab
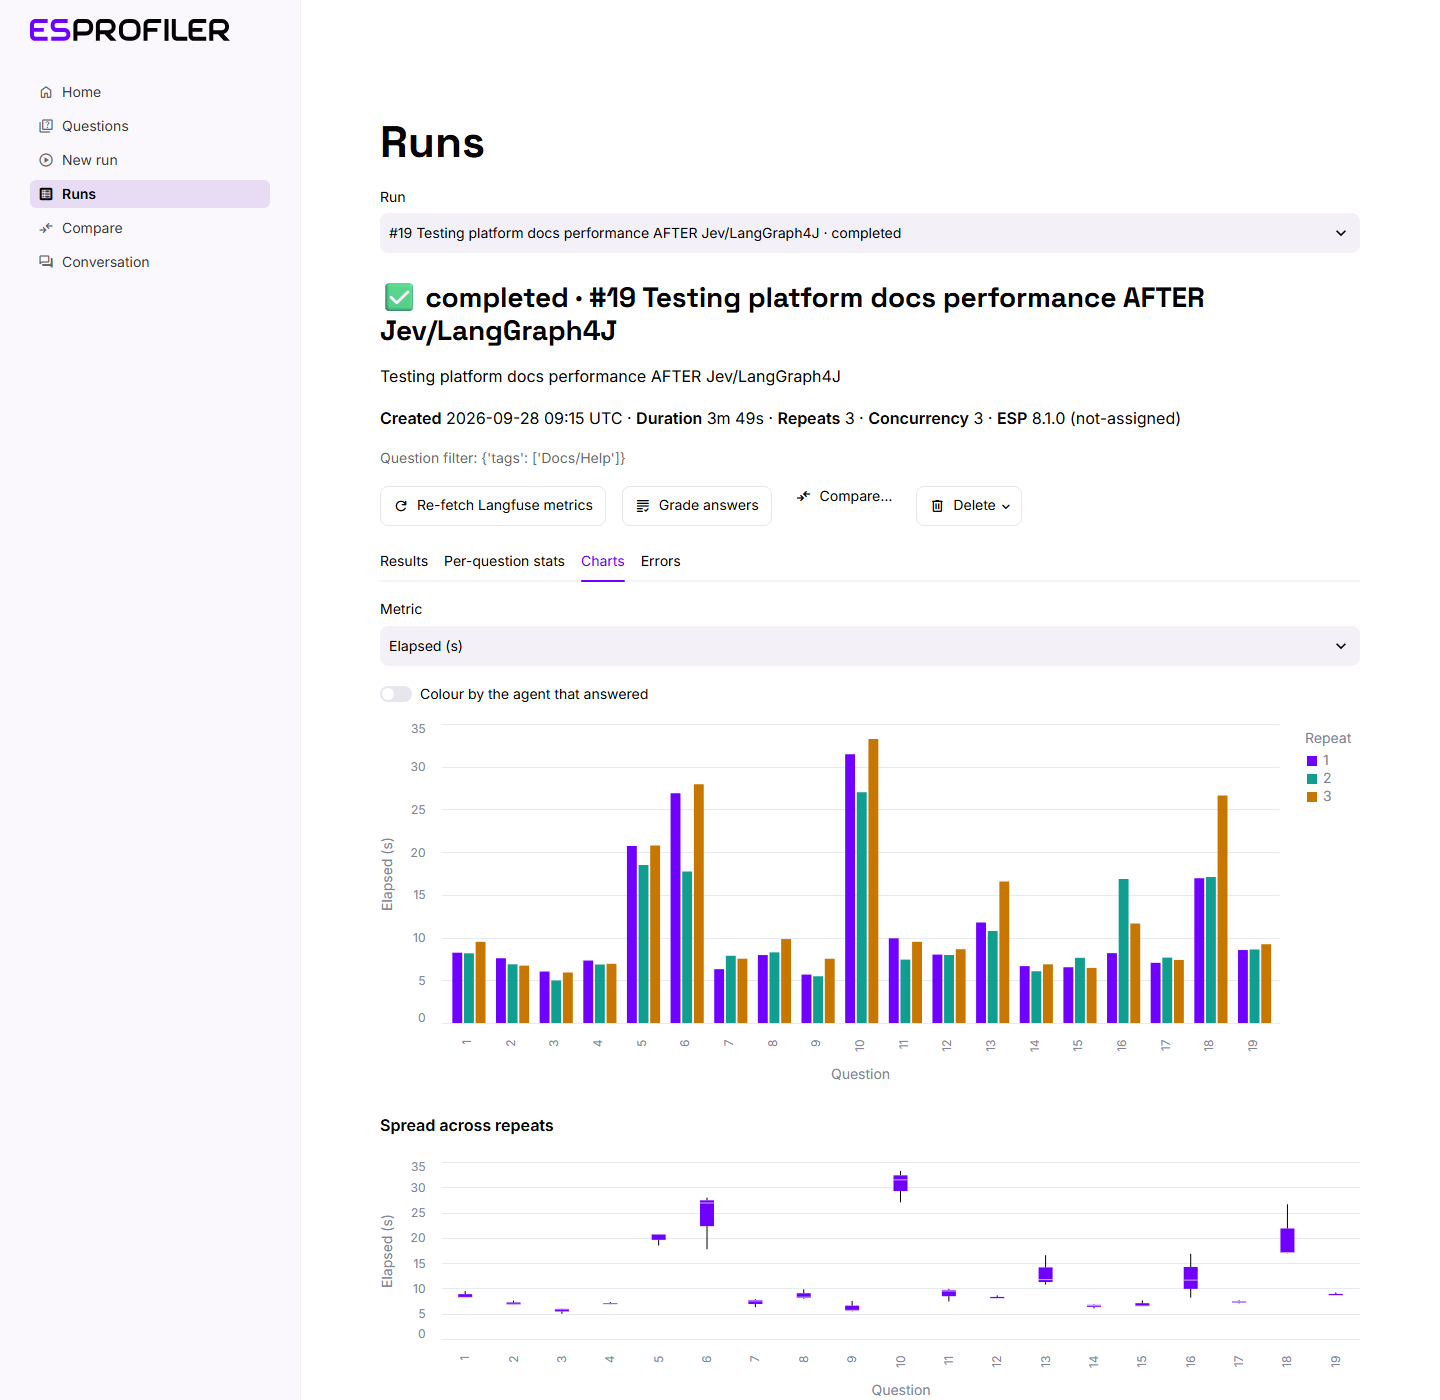
Pick a metric to plot it per question, with one bar per repeat. If the run has more than one repeat, a box plot underneath shows the spread across repeats. Langfuse metrics (cost, tokens, tool calls) only chart once enrichment has finished.
Turn on Colour by the agent that answered to colour the bars by agent instead of repeat: purple for the docs agent and teal for general chat, the same colours as the analysis charts. For runs with Jev decisions, Where Jev routed each question plots Jev's probability that the docs can answer each question (one dot per repeat), with the confidence gate as a solid line and p = 0.5, where Jev's choice flips, dotted.
Routing
Since run 19, platform-api routes each ESPi question with Jev: it either goes to the docs agent (a LangGraph4j graph over the platform docs) or falls back to general chat. The benchmark reads the decision from Langfuse during enrichment. Each result is in one of four states:
| State | Meaning |
|---|---|
| Jev decision | Jev was consulted. Shows the route, the reason (jev, or low confidence when the confidence gate overrode Jev's choice), p(docs) and the confidence. |
| Router, no Jev | The router ran but didn't ask Jev (e.g. jev disabled, message has attachments). Shows the route and reason only. |
| No router | The build has no router, e.g. current main or run 18. Every answer came from general chat. This is a normal state, not an error. |
| Not fetched | The result was enriched before routing was captured. Use Re-fetch Langfuse metrics to fill it in. |
Answered by can differ from Route: if the docs agent's retrieval fails, a question routed to the docs agent is answered by general chat (counted as a docs fallback).
The metrics use each question's expected route, set on the Questions page:
- Docs agent share: the fraction of answers produced by the docs agent.
- Expected hits: the agent that answered matches the expected route. This works for every build,
including ones with no router, so a
mainrun can be compared with a Jev branch run:mainonly scores on the questions expected to go to general chat. - Router accuracy: the router's route matches the expected route. It's n/a for a build with no router, rather than 0%.
Grading
Answers to questions that have a rubric are graded by a judge model once they finish. The rubrics live in
rubrics/*.yaml and are loaded with benchmark-espi import-rubrics; the Questions
page shows each question's full rubric. Each rubric has a reference answer and a list of criteria, each checkable
against the answer:
| Kind | Meaning | Points |
|---|---|---|
| Must | Required for a pass | 2 |
| Should | Extra credit, e.g. a correct product fact the docs don't mention | 1 |
| Must not | A known failure: invented UI, a wrong definition, claiming the docs say something they don't | −2, and the answer fails |
Each criterion also has a basis, which says where its ground truth comes from: docs (stated in
platform-docs), product (true of the product but not documented), data (a fact about the loaded data
snapshot, e.g. heavy) or web (an external market fact, as of the rubric's date).
The judge says for each criterion whether the answer meets it (yes, no, or n/a for a conditional criterion). The app then works out:
- Score: points earned, minus violations, out of the points possible (0 to 1).
- Grade: Pass (every must met), Partial (a must missed) or Fail (a must-not violated).
The Per-question stats tab shows Pass rate, Mean score, Must-not violations and the number graded, and Grade score is available as a chart metric. On a question the docs don't cover, an answer that honestly says so can still pass, because criteria based only on product facts aren't musts there.
There are two judges, chosen with JUDGE_PROVIDER in .env:
| Judge | Setting | Speed | What a grade shows |
|---|---|---|---|
| TypeSafe's Jev (default) | JUDGE_PROVIDER=jev, JEV_API_KEY | Well under a second per answer: a run is graded seconds after it finishes | Met or not, with P(yes), the judge's probability. Near 0.5 is a close call. |
A chat model, e.g. local Ollama with qwen3.8:27b | JUDGE_PROVIDER=openai, JUDGE_BASE_URL, JUDGE_MODEL | About 100 s per answer: a 57-answer run takes about 95 minutes | Met or not, with the evidence quoted from the answer, why, and a one-line summary |
Both agree with Claude's reference grades on about 91% of verdicts. If the judge can't be reached (no key, Ollama not running, rate limited), answers wait in the queue (Queued). A grade made before its rubric was edited is marked (stale): use Grade answers to re-grade. Grades made by one judge aren't directly comparable with the other's: re-grade both runs with the same judge before comparing them.
Errors tab
Lists every result that errored, with its question number and repeat. Stream errors from the copilot appear here.
Export
Download CSV and Download JSON export every result in the run with its question, tags and metrics. The link under the buttons opens the Langfuse project.
Compare
Compare puts one baseline run against one or more candidate runs. Use it to check whether a change (a new prompt, model or backend build) made the copilot faster, cheaper or more reliable.
You need at least two completed, cancelled or running runs. Compare… on the Runs page opens this page with that run as the baseline.
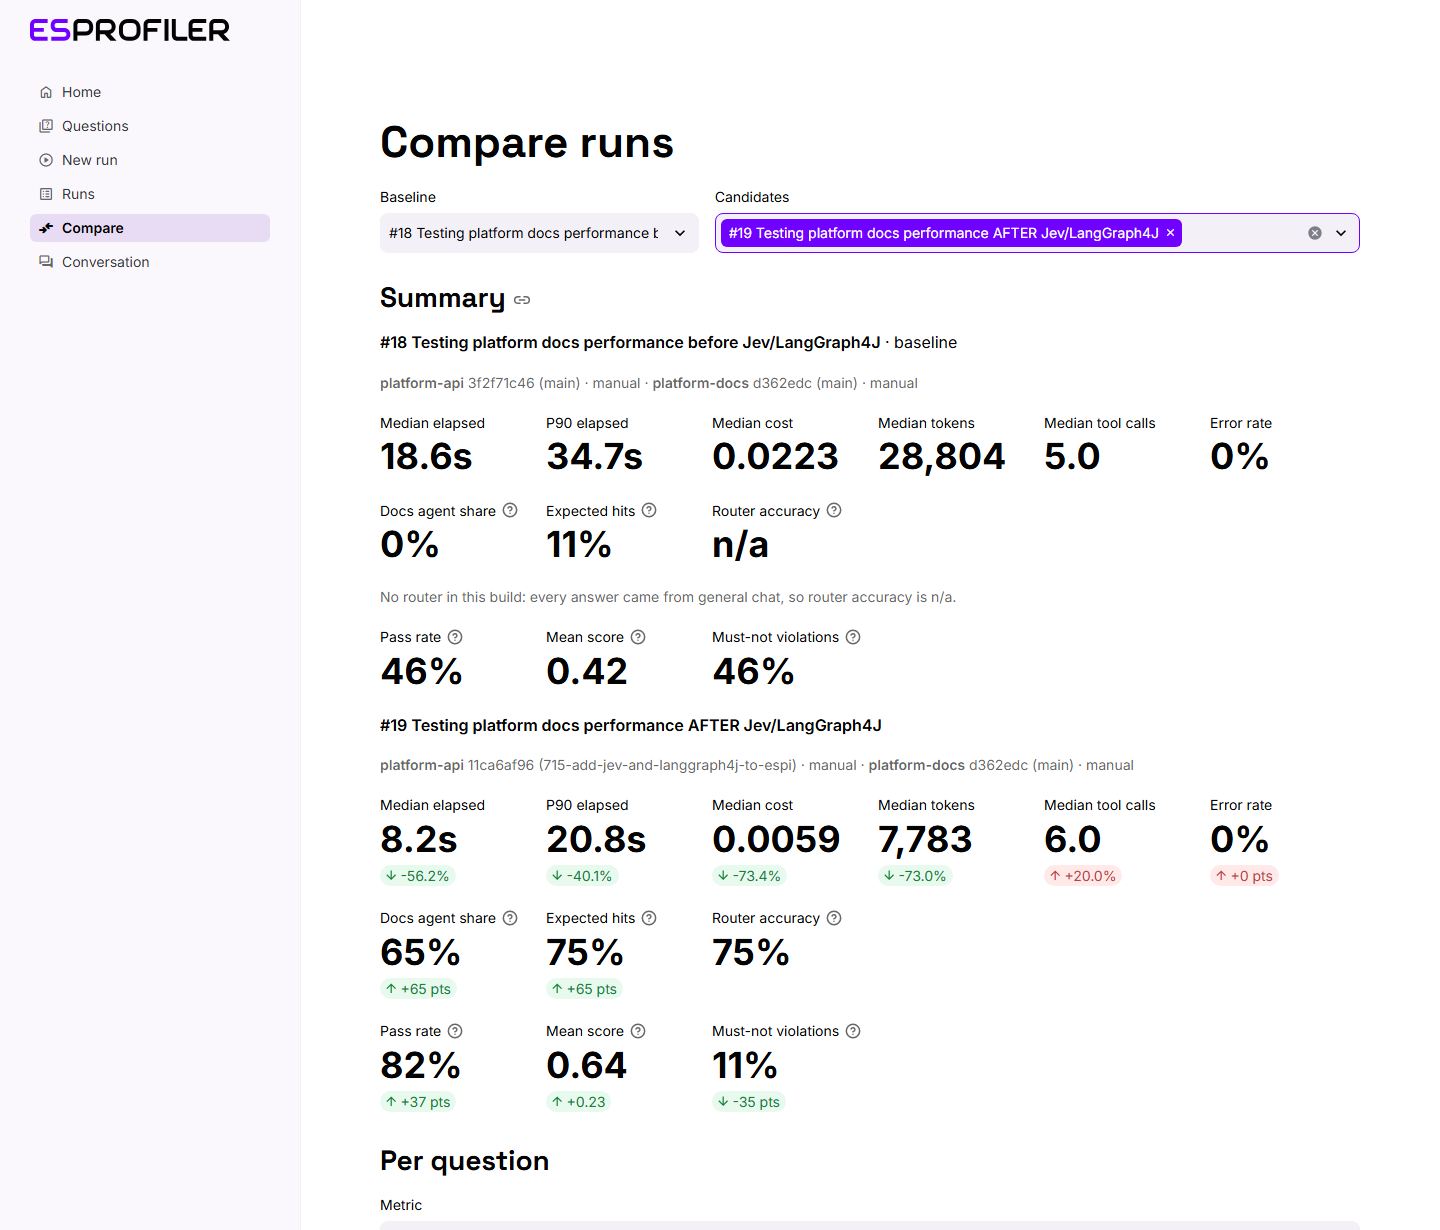
Choosing runs
- Baseline: the run to measure against.
- Candidates: one or more runs to compare with it. By default this is the most recent run other than the baseline.
Runs are compared question by question, so choose runs that share questions. Compare runs that used the same concurrency too, because concurrency affects latency.
Summary
For each run, six headline figures:
| Metric | |
|---|---|
| Median elapsed | |
| P90 elapsed | Slowest 10% of answers |
| Median cost | |
| Median tokens | |
| Median tool calls | |
| Error rate |
Each candidate shows its change against the baseline as a percentage (the error rate as a change in percentage points). Lower is better for all of them, so green means an improvement and red means a regression.
Once routing has been fetched, a second row shows Docs agent share, Expected hits and Router
accuracy (see Routing), with changes in percentage points. Higher is better for these. A
baseline with no router, such as a main build, shows router accuracy as n/a and no delta, but its
expected-agent hits still compare fairly.
Once answers have been graded, another row shows Pass rate, Mean score and Must-not violations (see Grading). Higher is better for the first two and lower for violations, and the colours follow that. Grades only compare fairly when both runs have the same questions graded.
Per question
Pick a Metric. The table shows each question's median value in every run, plus a Δ% column per candidate.
For Grade score higher is better, so Sort by biggest regression puts the biggest drops first. The answer
titles under Answers side by side include each answer's grade.
An · agent column per run shows how many of its answers came from the docs agent (e.g. docs 2/3), or no router. Turn on Colour by the agent that answered to plot each answer as a point in the agent colours instead of
the box plot.
Sort by biggest regression (on by default) puts the questions that got worst in the first candidate at the top.
Only questions that were answered successfully in every selected run are included. Any others are listed in a caption above the table.
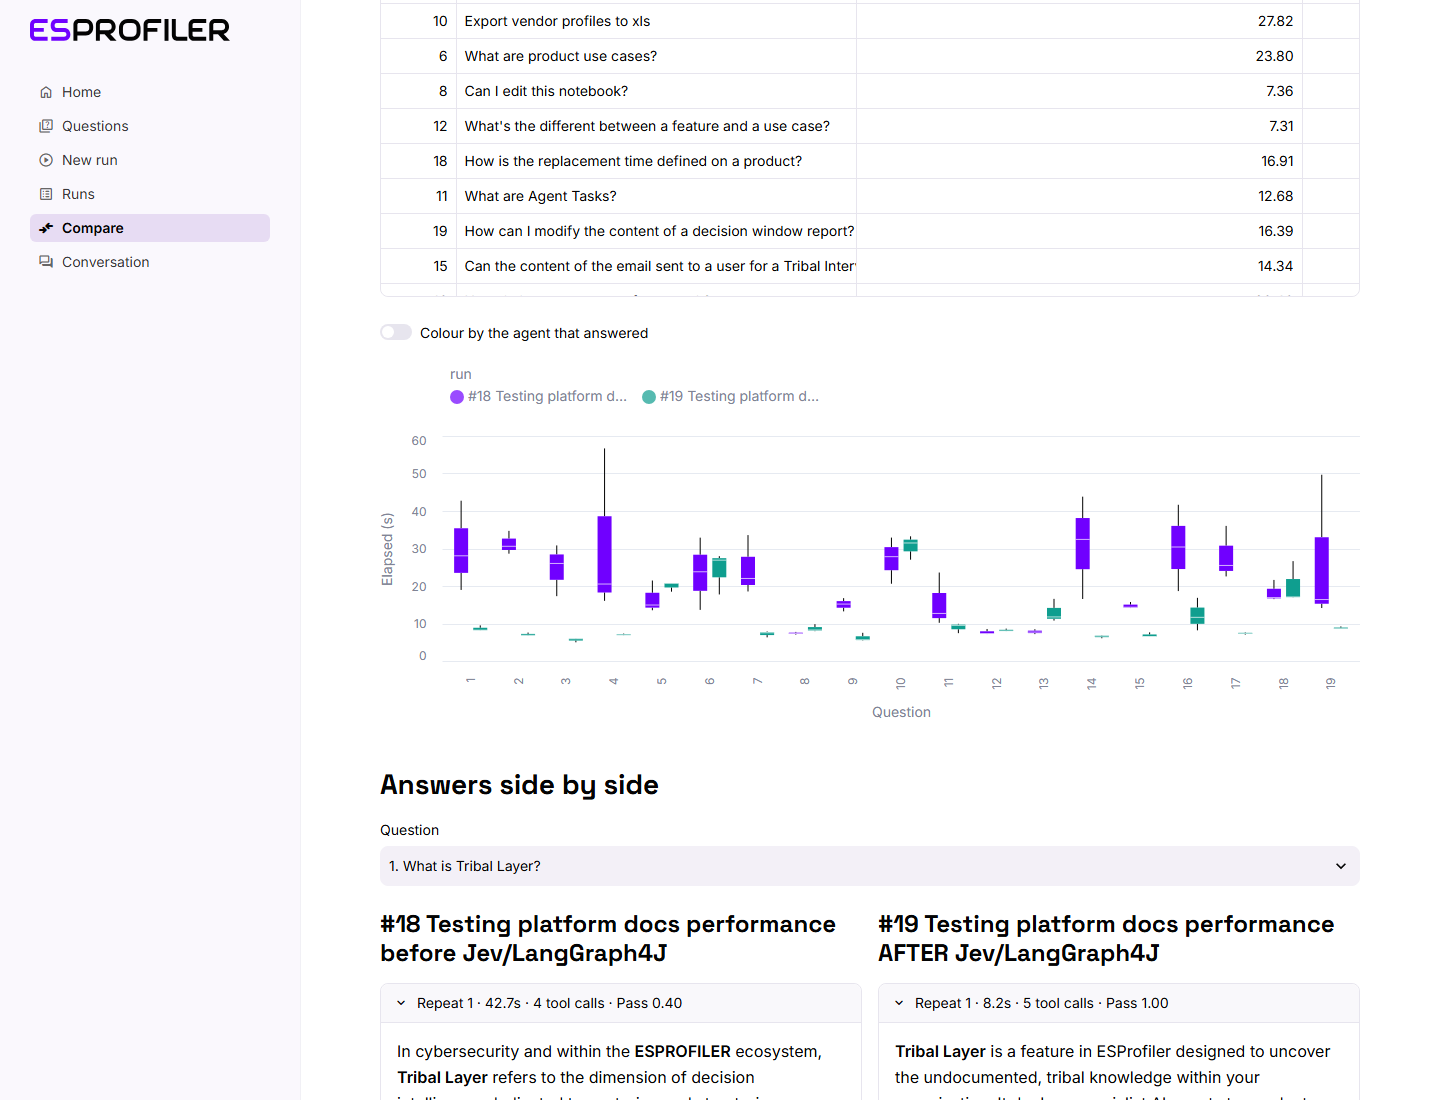
The box plot underneath shows each run's distribution per question, so you can tell a real shift from noise across repeats.
Answers side by side
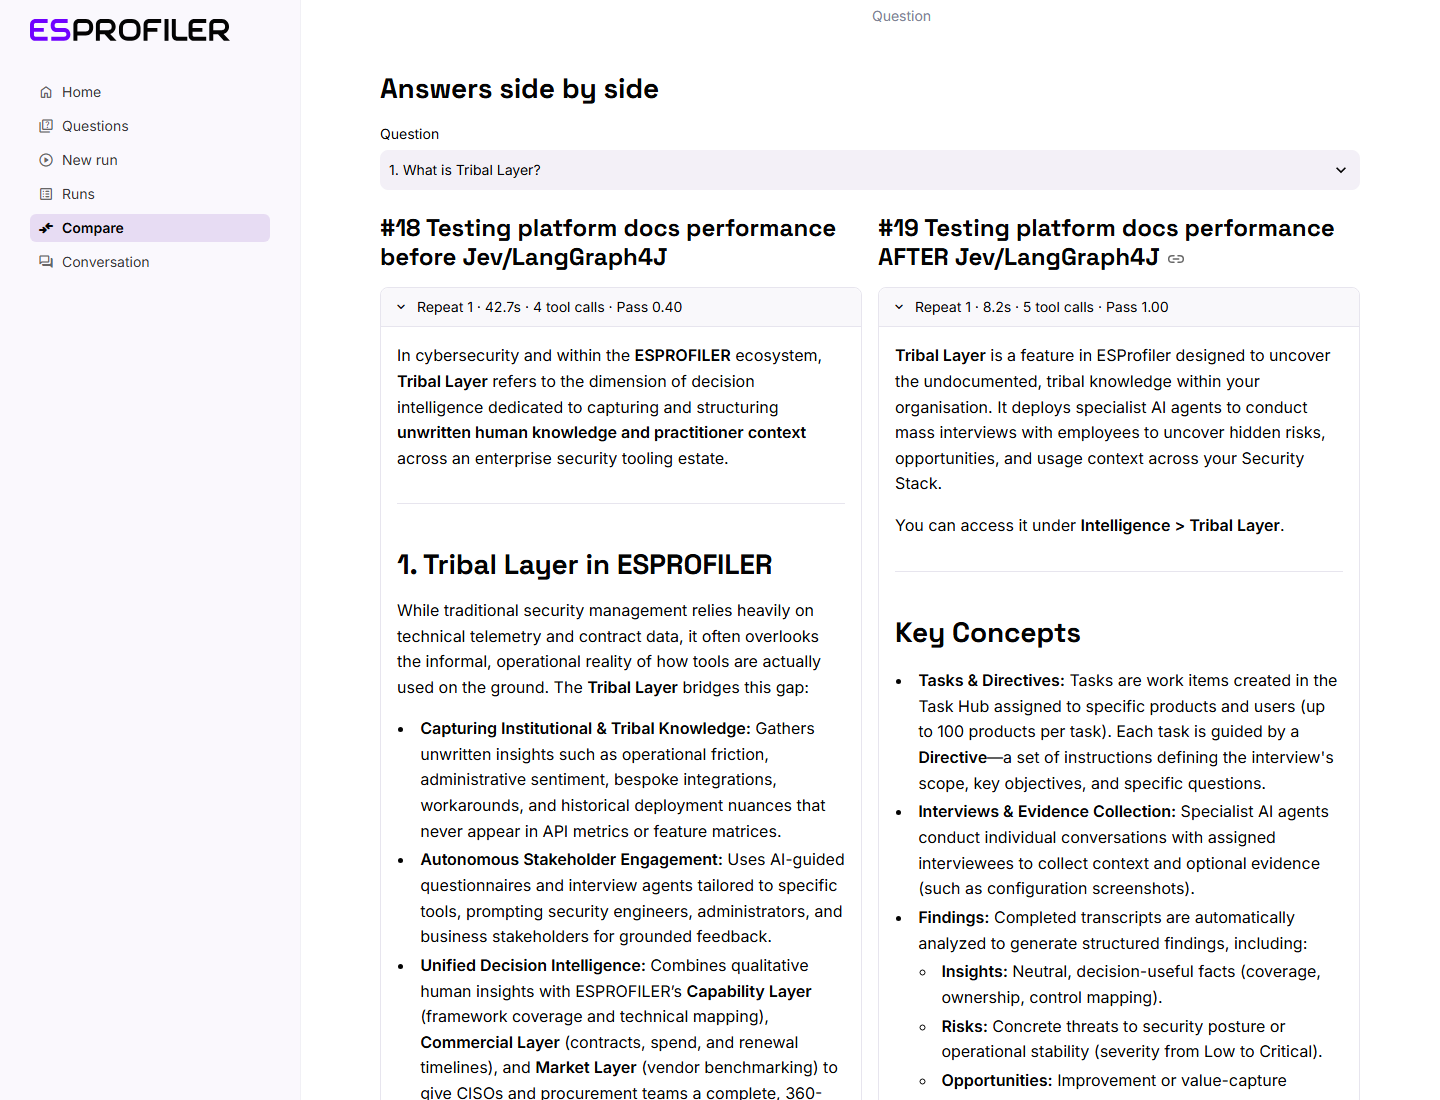
Pick a question to see each run's answers in columns, one expander per repeat. Each expander title shows the
elapsed time and number of tool calls. Inside you'll find the answer, any error, the tools used in order (e.g.
platform_docs_search_docs → platform_docs_read_docs), and an Open conversation link to the
Conversation page.
Conversation
The Conversation page shows everything recorded for one result: one question, asked once. You usually get here by selecting a row on the Runs page or clicking Open conversation on Compare. You can also type a Result id directly.
Overview
- Back to #… run returns to the run this result belongs to.
- The heading shows the question number and text, then the repeat number, status and tags.
- For a scenario question, a caption says which conversation turn it is and which page it was asked on. The conversation's other turns are listed as expanders with their answers and a link to each. A turn that wasn't asked says why: its page's entity wasn't in the loaded data, or an earlier turn failed.
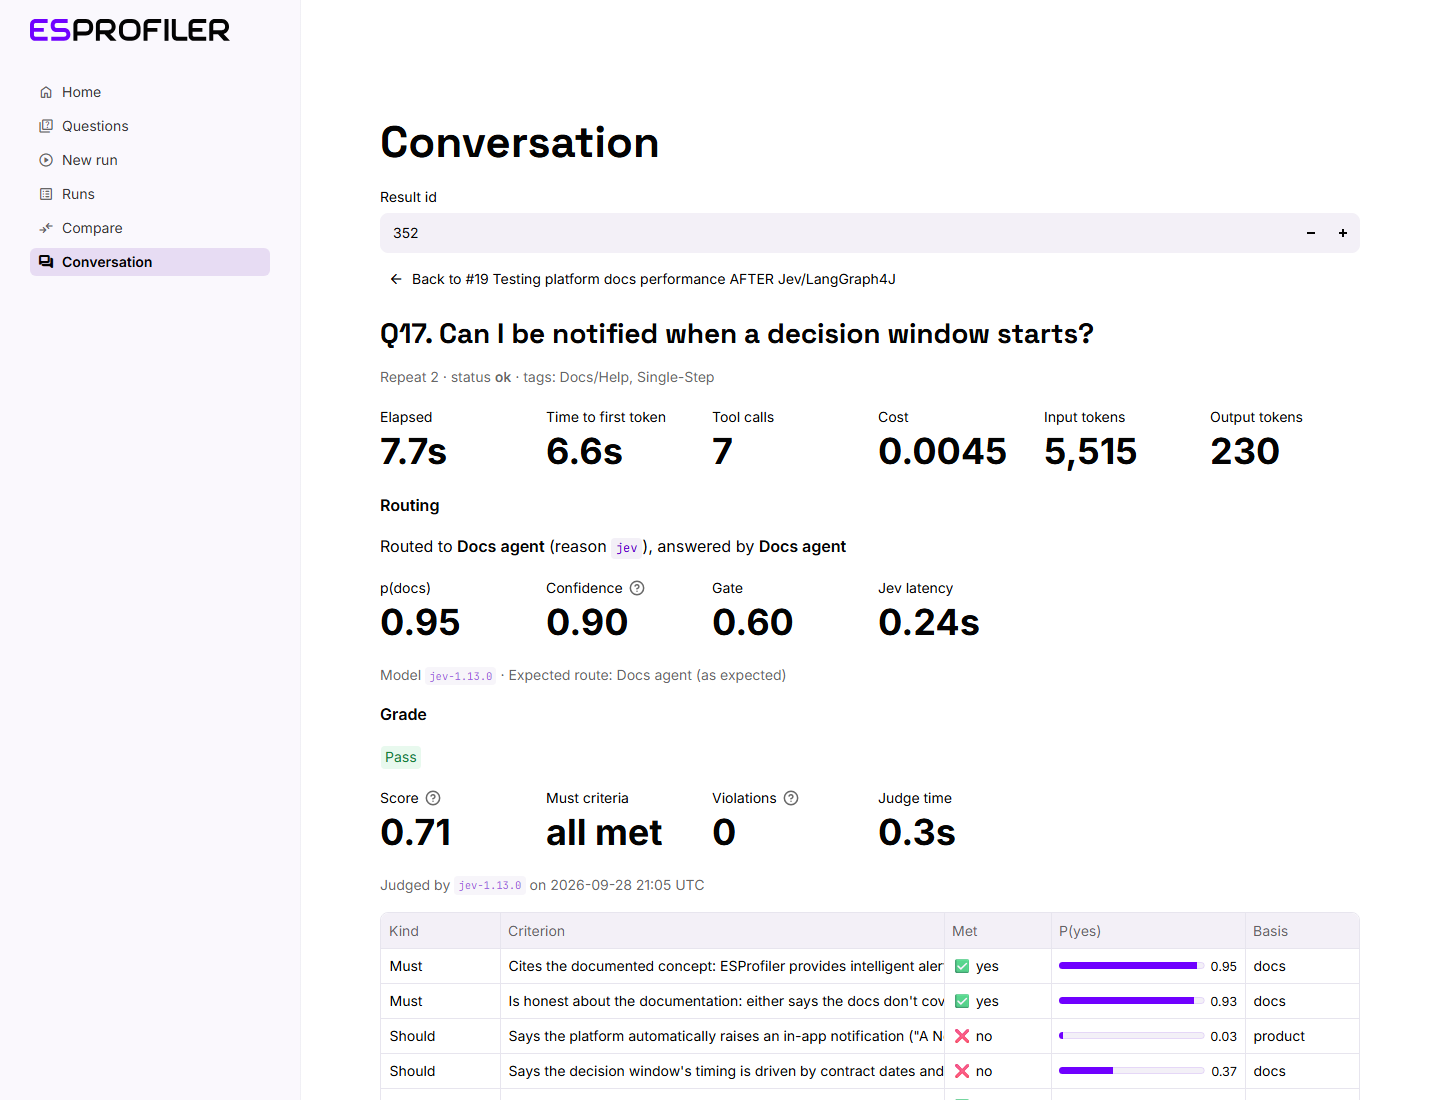
- The metrics row shows elapsed time, time to first token, tool calls, cost, and input and output tokens. Langfuse
figures show
–until enrichment has finished. - Routing says where the router sent the question, why, and who answered. For Jev decisions, tiles show Jev's p(docs), its confidence, the gate and Jev's latency. A caption gives the model, any override by the confidence gate, and whether the route matched the question's expected route. A warning appears when the docs agent was chosen but general chat answered. For a build with no router it just says so. See Routing.
- Grade shows the judge's verdict (Pass, Partial or Fail), tiles for the score, whether every must criterion was
met, the number of must-not violations and the judge's time, and a table with the judge's call on each criterion:
the criterion and whether it was met. A Jev grade adds P(yes), the judge's probability (met at 0.5 or more, so
values near 0.5 are close calls). A chat-model grade adds the evidence quoted from the answer, why, and a one-line
summary next to the verdict. For a must-not criterion, "yes" means the answer made that mistake. A caption names
the judge model and flags a stale grade. Rubric and reference answer shows what the judge was given, with a link to
the question's full rubric on the Questions page. See Grading.
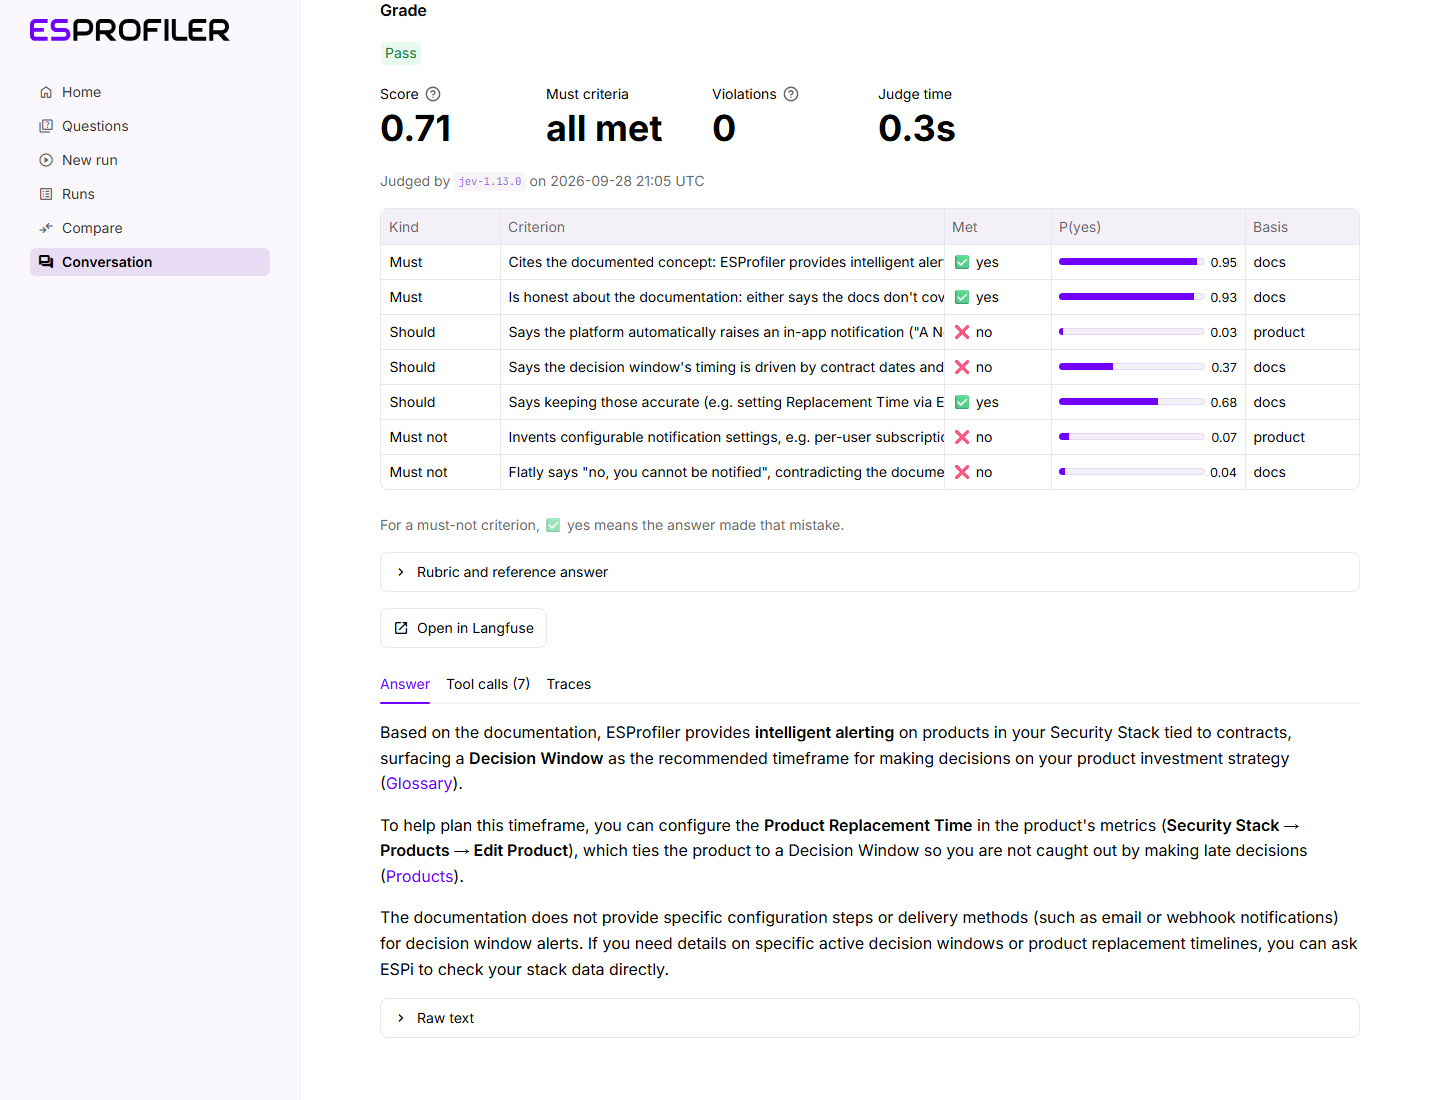
- Open in Langfuse opens the Langfuse session for this conversation (the session id is the ESP conversation id). It appears when Langfuse is configured.
- Any stream error is shown in red. If Langfuse enrichment failed, a caption gives the reason.
Answer tab
The answer, rendered as markdown. Expand Raw text to see or copy the unrendered markdown.
Tool calls tab
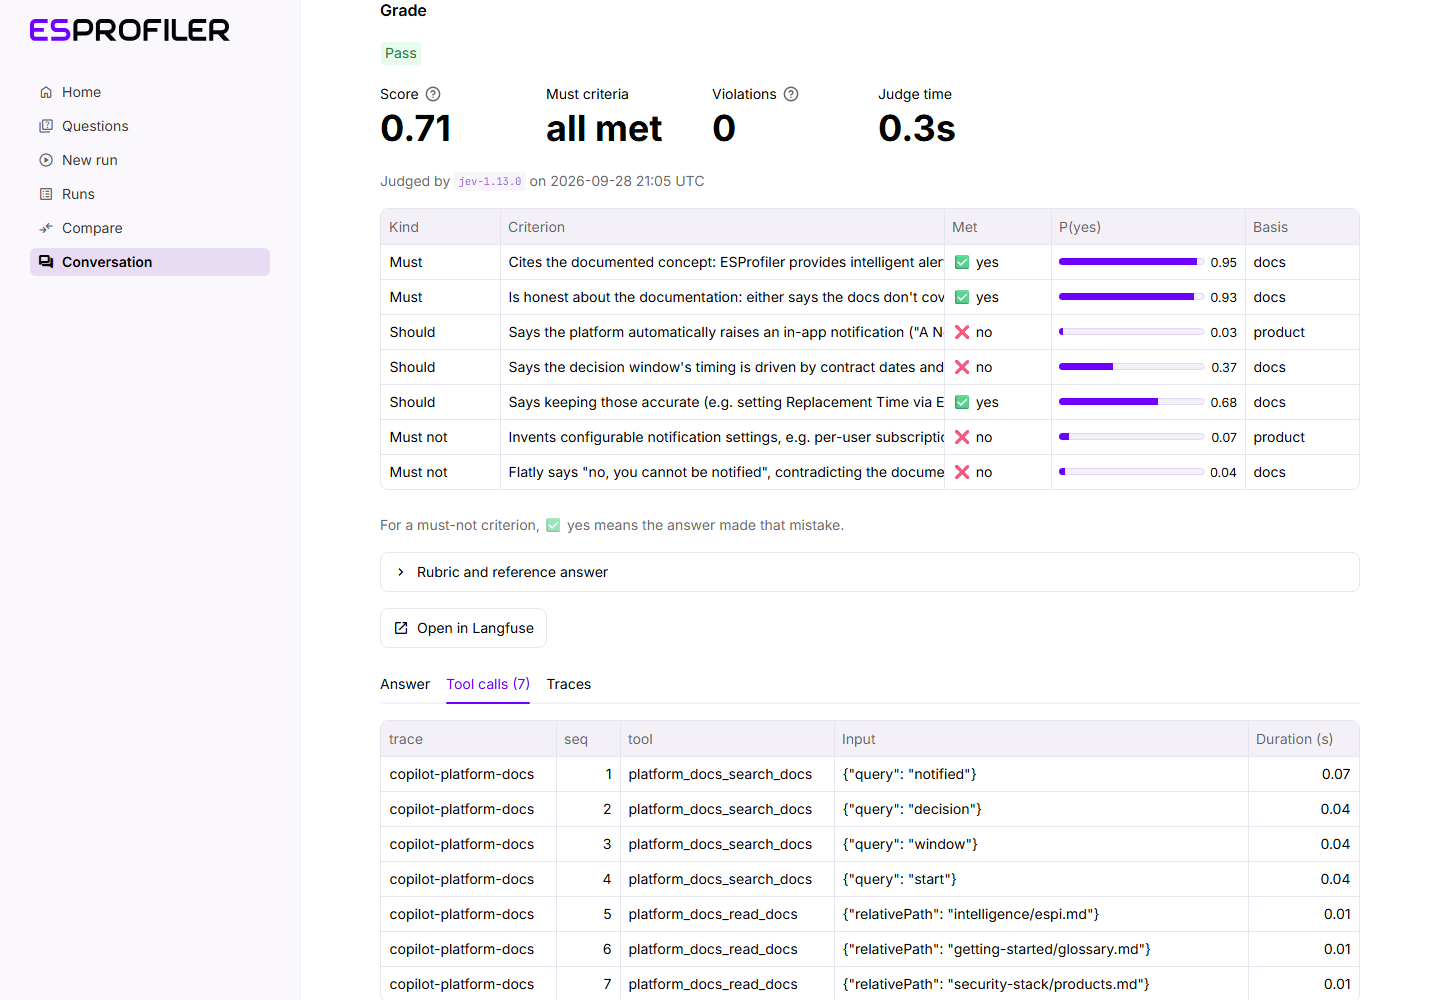
Every execute_tool* call the copilot made, in order, with the trace it belongs to, the tool name, its input and
how long it took. This is the quickest way to see how the agent found its answer, for example which docs it
searched for and then read.
Traces tab
A table of the Langfuse traces in the conversation: name, id, number of observations, tool calls, cost and elapsed
time. The trace name depends on the agent, e.g. copilot-platform-docs.
Load observation trees from Langfuse fetches each trace live and shows its full observation tree (spans, generations and tool calls, nested). It needs Langfuse keys and a real conversation, so it isn't available for dry runs. Fetched trees are cached for 10 minutes.