

Platform Ops
Platform Tasks
Often we will need to perform tasks on the platform as a platform admin, or even higher level, setting up tenants, etc. When we conduct these tasks, we should document them in GitHub as part of the admin repository. This ensures that the tasks are not forgotten and have clear ownership.
Production Logs
PostHog
We use PostHog to track product usage across the platform. We use PostHog's "Autocapture" feature to capture product interaction, as well as emitting specific events from our backend to PostHog such as:
esp-capability-mapping-requestedespi-message
You can view PostHog Activity to see a raw list of all events captured.
Report tagging and taxonomy
We want to ensure we have consistent and resilient tagging on elements within the platform.
This allows us to follow a practical naming taxonomy giving confidence that changes to structures within the codebase will not affect our PostHog reporting, further allowing us to quickly determine how new elements should be named.
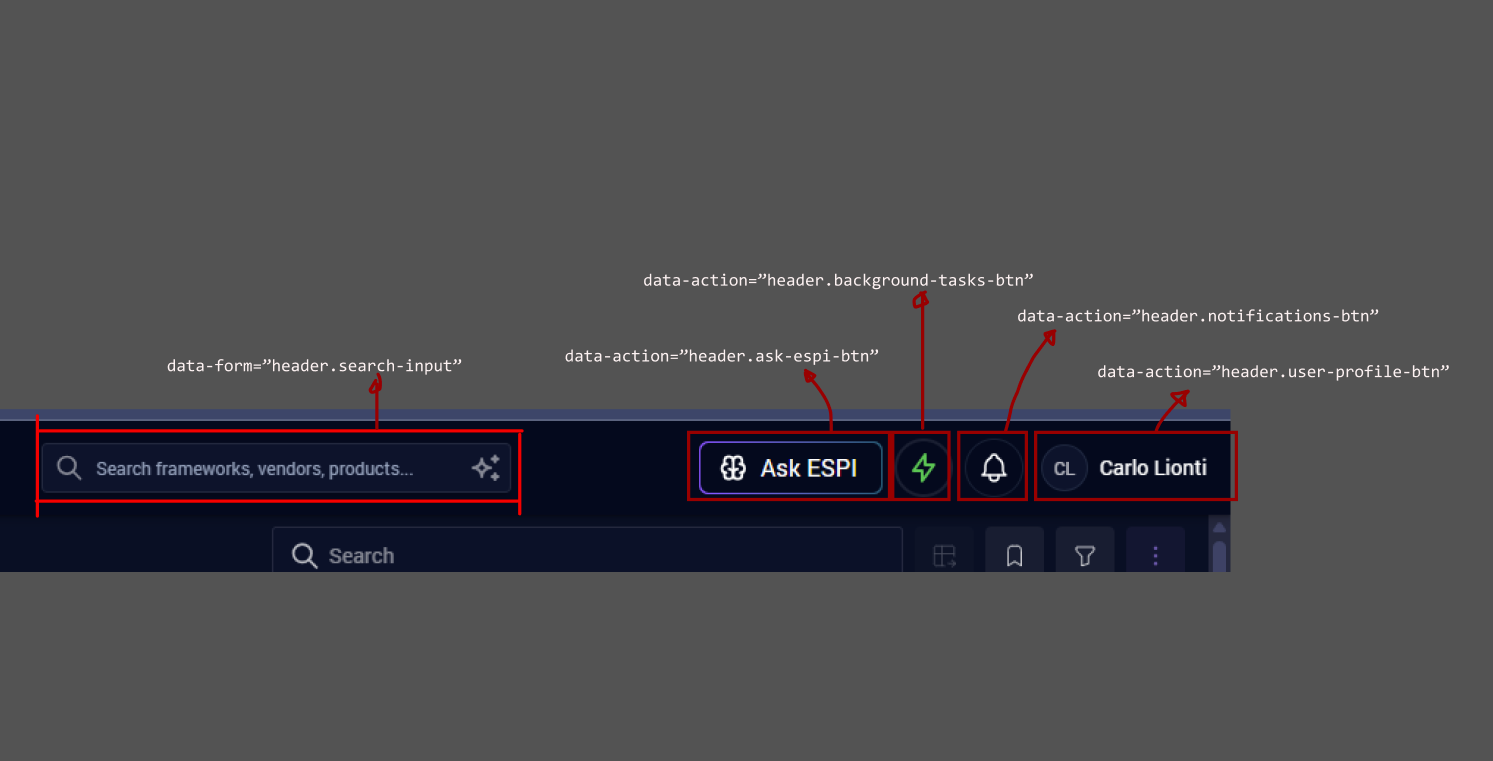
We use the data- attribute on HTML elements to ensure safe selection of objects.
These include:
data-nav- Tag elements that have a sole purpose of moving a user from one place to another. This is used for any navigation item in a side bar, tab or any of the primary navigation dropdown menus for switching team or user options.data-form- Identify particular form elements like text-input, textarea of dropdowns using this tag.data-action- Used to identify buttons that do not navigate, but instead complete an action. This could include submitting a form, or opening a dialog.data-el- A catch all for everything else, an element that we're likely going to want to capture, but doesn't fit into any of the other categories.
For the structure of the target object we propose:
[area].[subject]-[element]
This could be nested with:
[area].[area].[subject]-[element]
An example would be
data-action="header.notifications-btn"
PostHog Actions
We can classify our self-defined events and autocapture classified as PostHog Actions, where you can select user interactions in the form of explicit events or other behaviours. The benefit here is that you might have multiple events (that occur in different parts of the application) that all classify as the same "Action". Examples of a PostHog action include:
- Auth: Platform Login - Tracks when a user has logged into the platform.
- User Task: Create Task - Tracks when a user has created a new user task.
- ESPi: New Message - Tracks when a user has sent a message to ESPi.
- Portfolio: Map Capabilities - Tracks when a user has triggered a new mapping process for their portfolio.
- Agent Task: Start Task - Tracks when a user has started a new deep research/agent task.
Integrations: PostHog Destinations
We setup PostHog Destinations to automatically funnel events from PostHog out to other resources. We use Slack primarily here and report into the #ops-production channel.
If you want to start recording new events in Slack, add a new Destination. You can then define which events which you want to feed to the destination and the message format that is sent to Slack too. It is advised to follow conventions:
- Bot Name:
PostHog: Platform Ops - Emoji Icon: Use an appropriate emoji that differentiates it from other event types.
- Trigger Options: This can be a useful tool to limit the notification traffic going into Slack. You can choose whether every action/event triggers a message, or set intervals/limits, e.g. sending a notification just when a user sends their first ESPi message, rather than every message.
UptimeRobot
We use UptimeRobot to monitor the uptime of both our tenants and services. We also have it set up to alert us to any outage via the Slack channel #ops-uptime.
For our public-facing websites and applications, we also have a publicly viewable status page.
In order to edit or add a new status check, you need to be granted access. Louis is the best person to ask; if he is not available, Rory or Joe can be contacted.
Adding a New Monitor
Once you have access, you can view all of the current monitors by clicking on Louis Holt under the Your teams section in the left-hand navigation bar.
To add a new monitor, click the "New Monitor" button in the top right corner. Enter the URL you would like to monitor. Depending on whether you want to monitor a tenant or a service, the URL format will be different:
- Tenant:
https://<tenant>.own.esprofiler.com/bootstrap - Service:
https://login.esprofiler.com/<service>/v1/act/health
The naming format is as follows:
- Tenant:
C | <Customer's Name> - Service:
P | <Service Name>
Next, select the Integrations & Team tab and select "All" for notifying team members. The most important thing is to ensure that the ESPROFILER Slack integration is selected, as this ensures that any outage gets notified on our Slack.
To finish, click Create monitor at the bottom of the page.